
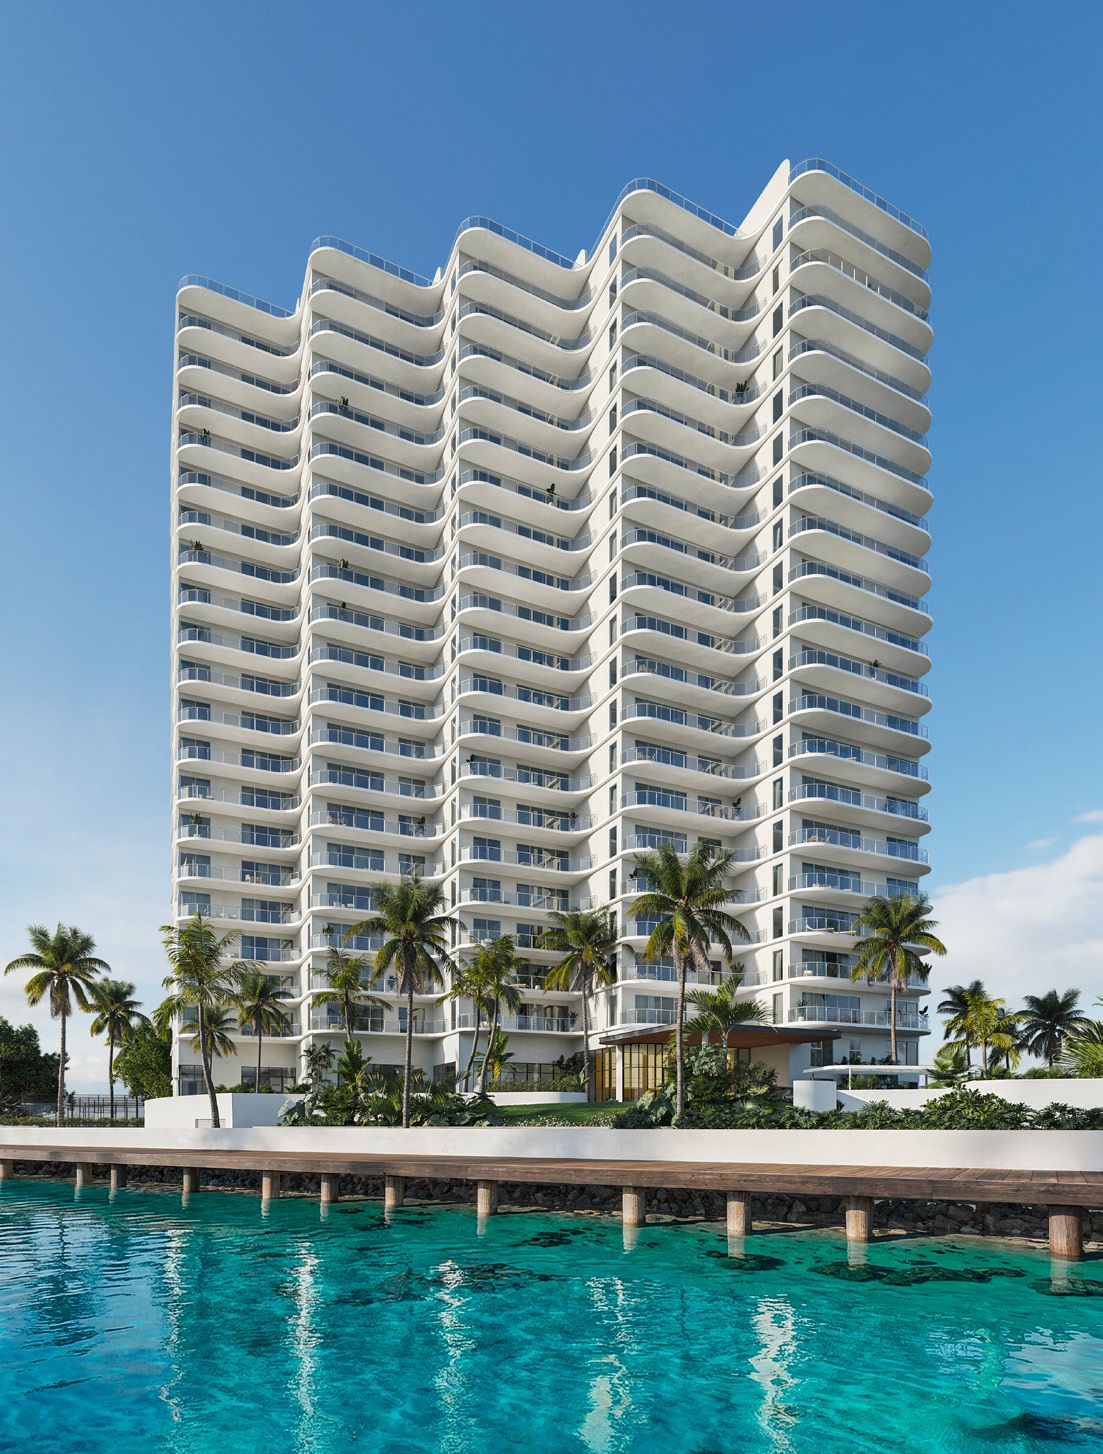
Someone buying a luxury pre-sale rarely has all their capital idle in a bank account. More often part of their money is already working in fixed income or the stock market, and the right question is not "where do I get the down payment?" but "how do I keep my portfolio earning while the pre-sale is paid off?" In this guide we simulate it with numbers, using the 20/30/50 payment plan we explained in our guide to dollar pre-sales with a fixed exchange rate.
In the base scenario, funding a USD 2,000,000 SLS pre-sale from a 6% fixed-income portfolio turns USD 2,000,000 of starting wealth into about USD 3,146,000 at delivery (+57%, roughly 23% a year), versus USD 2,969,000 (+48%) if the same money had simply sat idle. With part of it in equities the result rises to about USD 3,223,000, but if the market falls during those 26 months that tranche can fall short and the payment has to be topped up from other money. The example assumes 20% annual appreciation for the property, which is a scenario, not a promise.
We are not counting vacation rental income here: short-term rental is not allowed in Puerto Cancún, so this investment's return comes from the unit's appreciation and from the portfolio that funds it.
The idea is simple: start with a portfolio and withdraw exactly what falls due each month. With everything in 6% fixed income, the capital needed today is not the contract's USD 2,000,000 but about USD 1,843,700, because the returns pay for part of the price. This is how the balance evolves:
| When | Portfolio balance (USD) | What happened |
|---|---|---|
| Today, after the down payment | 1,443,698 | 20% paid (USD 400,000) |
| Month 6 | 1,346,220 | 6 installments paid |
| Month 12 | 1,245,861 | One year of installments |
| Month 18 | 1,142,535 | 18 installments paid |
| Month 24 | 1,036,155 | Final tranche still ahead |
| Month 26 (delivery) | 0 | Final 50% settled (USD 1,000,000) |
We start with an investor holding USD 2,000,000 in liquid assets today and compare three strategies. We measure final wealth: the property (with 20% annual appreciation) plus whatever is left in the portfolio.
| Strategy | What happens to the money | Wealth at month 26 (USD) | Total return | Annualized |
|---|---|---|---|---|
| A. Idle cash | Paid from savings that earn nothing | 2,968,858 | +48.4% | 20.0% |
| B. Fixed-income portfolio (6%) | Divest for each payment, the rest stays invested | 3,146,193 | +57.3% | 23.3% |
| C. Fixed income + stocks (10%) | Stocks for the final payment, fixed income for the rest | 3,223,313 | +61.2% | 24.6% |
The gap between A and B is about USD 177,000: the return on money that sat idle under strategy A. Strategy C adds another ~USD 77,000, but with a risk worth looking at squarely.
Under strategy C, USD 813,000 of the portfolio goes into stocks so it reaches USD 1,000,000 exactly when the final payment is due. But 26 months is a short horizon for equities. If the S&P 500 loses 15% a year over that period, the tranche is worth ~USD 572,000 instead of USD 1,000,000: about USD 428,000 short, covered by the leftover and about USD 174,000 more from other savings. Even so, final wealth would be ~USD 2,795,000 (+39.8%), because the property keeps its value. A 2008-style drop (-37%) would mean an additional shortfall of ~USD 233,000.
Money you will need in under three years (the down payment, installments and the final payment) belongs in fixed income. Stocks suit what is left over and can stay invested longer, not the delivery payment that has a fixed date.
Appreciation is the variable that matters most. This is how final wealth changes by strategy at different annual appreciation rates:
| Annual appreciation | A. Cash | B. Fixed income | C. Fixed income + stocks |
|---|---|---|---|
| 0% | 2,000,000 (0%) | 2,177,335 (+8.9%) | 2,254,455 (+12.7%) |
| 10% | 2,458,749 (+22.9%) | 2,636,084 (+31.8%) | 2,713,204 (+35.7%) |
| 20% | 2,968,858 (+48.4%) | 3,146,193 (+57.3%) | 3,223,313 (+61.2%) |
With zero appreciation the portfolio still adds something; at 10% it already beats a conventional account. Puerto Cancún has historically grown at around 18% to 23% a year, and typical appreciation between signing and delivery on Cancún pre-sales runs 25% to 30%, per the data in our price per m² analysis, but the past does not guarantee the future.
This content is informational and is not financial, tax or legal advice. Past returns do not guarantee future results. Talk to your financial advisor before deciding.
Want us to build this simulation with the real price of the unit you like and your own portfolio? Compare the options in SLS vs. Thompson or leave us your details and we will prepare it.
We will prepare a simulation using the unit's real price and your portfolio, no commitment.
Talk to an advisor